Banff Classification for Renal Allograft Pathology, 2022
INTRODUCTION
Since its first consensus meeting in 1991,1 the Banff Classification Of Allograft Pathology has provided a framework for the reporting of renal allograft biopsies. It was the first classification system of its kind and answered the need for an international consensus on renal transplant biopsy reporting, providing guidance for clinical diagnosis and enabling meaningful comparison between research studies and clinical trials investigating the diagnosis, treatment and outcome in kidney transplantation. The Banff Classification has since been further strengthened by evidence-informed biannual updates elaborated during open international expert meetings.2 As a result, the Banff Classification of Allograft Pathology has become the predominant classification system used worldwide.3 A total of 16 meetings with changes to the classification reported in 11 articles reflect the developments of the Banff Classification from the first consensus meeting in 1991 to the recently published consensus after the 2022 meeting in Banff, Canada.1,4-14 Each of these iterations provides a short summary of the meeting and contributes to the classification in a cumulative fashion. The dispersal of both relevant and outdated content over 11 articles could make access to the Banff Classification difficult for beginners and experts and has created ambiguities in the past.3 Yet, accessibility and clarity are of utmost importance not only for clinical practice and research but also for the Banff Classification itself to evolve through accountability, critique, and change. To improve on these aspects, the Rules and Dissemination Banff Working Group was initiated at the last Banff meeting held in Barcelona, Spain in March 2017. With a scope beyond the helpful syllabus provided by the Banff group in the online supplement of the 2015 update11 and incorporating the latest changes introduced in the 2017 update,12 the aim of this Working Group is to collate all current content of the Banff Classification and improve its accessibility. A systematic inventory of the content is given in Figure 1.
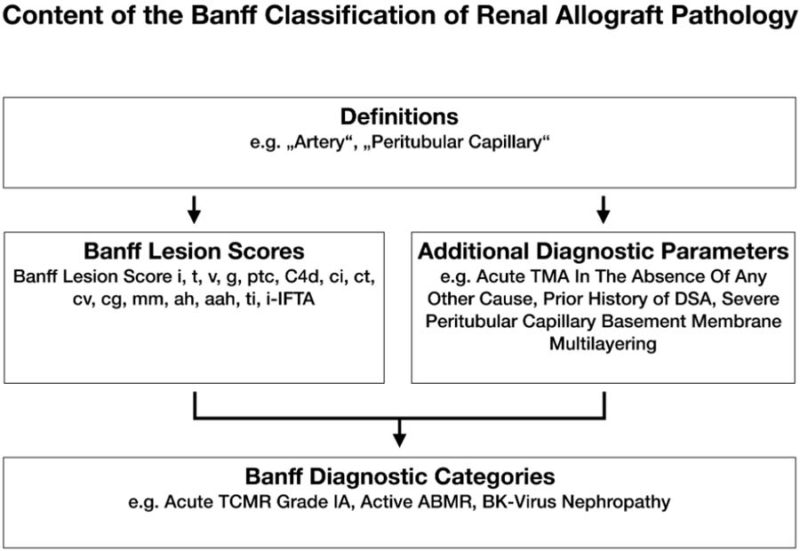
Figure 1. The content of the Banff Classification of Kidney Allograft Pathology can be inventoried as Banff Lesion Scores and Additional Diagnostic Parameters required by the algorithms behind the Banff Diagnostic Categories to reach a diagnosis. Moreover, overarching definitions are important and inform, for example, how one or even several Banff Lesion Scores are applied. TMA, thrombotic microangiopathy.
This practical guide is based on the 2018 review, updated with the 2019 and 2022 meeting reports. The content of this on-line document is divided into the following sections: a brief guide about the histopathological and serological work-up; a list of Banff Lesion Scores (previously known as components, e.g. Banff t for tubulitis) with their current definitions; practical tips for their application and illustrative figures (see definitions below, thresholds in Table 1 and all Figures); a list of Banff Diagnostic Categories in Table 2; and a list of the Additional Diagnostic Parameters in Table 2. Finally, we provide in Table 3 the Banff Diagnostic Categories and the underlying algorithms. A glossary of terms is provided in the appendix below, explaining important concepts and terminology underlying the Banff Classification. Lastly, we provide a critical appraisal of areas of the Banff Classification that require clarification and provide an outlook for future developments. All terms from the Banff Classification will be given in capitals for clarity. All abbreviations for Banff lesion scores will be given in italic typeface.
We hope this Banff 101 will serve as a handy reference for the clinicians and the pathologists. Updated content will appear online with the next update of the Banff Classification of Renal Allograft Pathology.
DIAGNOSTIC WORK-UP OF BIOPSIES
A kidney transplant biopsy should fulfil the criteria for specimen adequacy (see Glossary of Terms, in the appendix below) detailed in the Banff 1997 update.5 C4d staining is considered indispensable, either as immunofluorescence (IF) on fresh frozen or immunohistochemistry (IHC) on paraffin-embedded tissue. The paraffin block should be cut in several numbered level sections examined with hematoxylin-eosin, periodic acid-Schiff (PAS), trichrome-elastic and Jones or methenamine silver stains. Immunohistochemistry staining for simian virus-40, cross-reacting with BK virus is highly recommended when indicated. Where available, minute portions of cortex should be embedded for transmission electron microscopy (EM).
Depending on clinical and histopathological findings a complete nephropathological work-up including staining for immunoglobulin heavy and light chains and complement split products might be necessary to rule out or confirm a diagnosis of glomerulonephritis. Other ancillary staining might be necessary as for native kidney biopsies to establish specific recurrent or de novo kidney diseases (eg, Congo red stain).
Serological testing for donor-specific antibodies (DSAs) should be performed as described in consensus documents.14 Ancillary molecular tests, based on tissue and body fluids, are emerging.
Preimplantation biopsies should be obtained, processed, and reported as described by the Banff Working Group on Preimplantation Biopsies.15
BANFF LESION SCORES
Banff Lesion Scores assess the presence and the degree of histopathological changes in the different compartments of renal transplant biopsies, focusing primarily but not exclusively on the diagnostic features seen in rejection. These Banff Lesion Scores are not by themselves sufficient to reach the various Banff Diagnostic Categories in Table 1; the Additional Diagnostic Parameters—histopathological, molecular, serological and/or clinical—may be required to determine the diagnosis. For each Banff Lesion Score we give the current consensus definitions below. As new knowledge emerges, these might be refined for the next Banff update. A synopsis of their semiquantitative thresholds is given in Table 2. However, use of this threshold table without knowledge of the precise definitions and regulatory statutes underlying each Banff Lesion Score is strongly discouraged.
Banff Lesion Score i (Interstitial Inflammation)
This score evaluates the degree of inflammation in non-scarred areas of cortex, which is often a marker of Acute T Cell–Mediated Rejection (TCMR). As per the Banff update from 1997, areas that must not be considered for Banff Lesion Score i are “fibrotic areas, the immediate subcapsular cortex, and the adventitia around large veins and lymphatics”.5 As can indirectly be derived from the definition of Banff Lesion Score ti in the 2007 update of the Banff classification, nodular infiltrates, if in unscarred cortex, are also8 considered for Banff Lesion Score i. An asterisk shall be added to Banff Lesion Score i (e.g., i1*), “if there are more than 5% to 10% of eosinophils, neutrophils or plasma cells”.5 Exemplary lesions are shown in Figure 2.
i0—No inflammation or in less than 10% of unscarred cortical parenchyma.
i1—Inflammation in 10 to 25% of unscarred cortical parenchyma.
i2—Inflammation in 26 to 50% of unscarred cortical parenchyma.
i3—Inflammation in more than 50% of unscarred cortical parenchyma.11

Figure 2. Banff Lesion Score i (interstitial Inflammation in non-scarred areas of the cortex). A, Interstitial inflammation in non-scarred areas of the cortex. This Banff Lesion Score, often a marker of TCMR, ranges from 0 to 3, based on the percentage of non-scarred cortex involved, and is usually dominated by mononuclear cells in the case of Acute TCMR. Note the contrast between the non-infiltrated interstitium in the right half of the micrograph and the infiltrate in the edema between the tubules on the left (long arrow). PAS, original magnification x400. B, An example of plasma cell rich interstitial inflammation. If the infiltrate comprises more than 5% to 10% of either eosinophils, neutrophils or plasma cells an asterisk is added to the Banff Lesion Score i (e.g. i1*). H&E, hematoxylin and eosin, original magnification x400.
Banff Lesion Score t (Tubulitis)
This Banff Lesion Score evaluates the degree of inflammation within the epithelium of the cortical tubules. As per the Banff 2003 update “Tubulitis—the presence of mononuclear cells in the basolateral aspect of the renal tubule epithelium” is one of the defining lesion of TCMR in kidney transplants.6 According to Banff 1997, in tubules cut longitudinally, the score shall be determined as the number of mononuclear cells per 10 tubular epithelial cells, which is the average number of epithelial cells per tubular cross-section (Figure 3).

Figure 3. Banff Lesion Score t (tubulitis) in non-atrophic or mildly atrophic tubules. These images display various degrees of tubulitis which is characterized by the presence of mononuclear cells on the basolateral aspect of the tubular epithelial cells, within the confines of the basement membrane. Mononuclear cells (long and short arrows) are noticeable by their characteristic halo and smaller nucleus and more condensed chromatin compared to tubular epithelial cells. A, Banff Lesion Score t0—Cortical tubules without tubulitis which would be scored as t0. H&E, original magnification x200. B, Banff Lesion Score t1—defined as foci of 1-4 mononuclear cells (arrows) per tubular cross section or per 10 tubular epithelial cells. PAS, original magnification x400. C, Banff Lesion Score t2—defined as 5 to 10 mononuclear cells per tubular cross section or per 10 epithelial cells (long arrows). Note that the tubule to the left displays mild tubulitis (short arrows), but the most severely affected tubule dictates the score. PAS, original magnification x400. D, Banff Lesion Score t3—defined as foci with >10 mononuclear cells/ tubular cross section. Note that for this particular tubule the denominator is per 10 tubular epithelial cells as this tubule is sectioned longitudinally. PAS, original magnification x400.
Tubulitis must be present in at least 2 foci. We have emphasized this by rephrasing the criteria for Banff Lesion Score t0 below; the most severely affected tubule determines the score.5,11 Please note also that we have returned from the altered definition with “leukocytes” in the Banff 2015 update11 to “mononuclear cells” as given in the 1997 update.5 Also revoked is the change introduced with Banff 2017 that for Acute TCMR Grade IA, IB and Chronic Active TCMR Grade IA and IB but not Borderline (Banff Diagnostic Category 3), tubulitis is considered in all but severely atrophic cortical tubules. Thus, the old rule introduced in Banff 1997 that Banff Lesion Score t must only be scored in cortical tubules with less than 50% reduction in caliber 5 is valid again. The reason for this reversal is that with the introduction of Banff Lesion score t-IFTA (see below) in Banff 201913 this 2017 expansion of Banff Lesion Score t became obsolete and is best be avoided in order not to compromise one of the oldest and diagnostically most important Banff Lesion Scores. According to Banff 2019, lesion score t should only be scored in “preserved” areas of cortex, without interstitial fibrosis/tubular atrophy. An example of tubulitis in various stages of tubular atrophy is shown in Figure 4.
t0—No mononuclear cells in tubules or single focus of tubulitis only.
t1—Foci with 1 to 4 mononuclear cells/tubular cross section (or 10 tubular cells).
t2—Foci with 5 to 10 mononuclear cells/tubular cross section (or 10 tubular cells).
t3—Foci with >10 mononuclear cells/tubular cross section or the presence of ≥2 areas of tubular basement membrane destruction accompanied by i2/i3 inflammation and t2 elsewhere. 12

Figure 4. Banff Lesion Score t-IFTA (tubulitis) in moderately atrophic tubules. Moderately atrophic tubules are defined as having less than 50% down to 25% of the diameter of the surrounding “unaffected or minimally affected [cortical] tubules in the biopsy”.12 This example shows such unaffected or minimally affected tubules with their diameter marked in black. Their mean diameter in this image would be around 48 μm. The tubule with the diameter marked in grey has a diameter of 27 μm which is more than 50% of 48 μm. Thus, this tubule would still qualify as mildly atrophic and would inform Banff Lesion Score t if this lesion was found in multiple (at least 2) foci. It is heavily infiltrated with mononuclear cells (grey arrows). In contrast, the tubule with the diameter of 20 μm marked in red is moderately atrophic, hence it would inform Banff Lesion score t-IFTA, but not Banff Lesion Score t. PAS, original magnification x400.
Banff Lesion Score v (Intimal Arteritis)
This Banff Lesion Score evaluates the presence and the degree of inflammation within the arterial intima. Arteries are defined as having at least 2 layers of smooth muscle cells in the media (Glossary of Terms, see in the appendix below). Note that intimal arteritis (also referred to as endothelialitis and endarteritis) is defined by the presence of inflammatory cells, mainly lymphocytes and monocytes, in the subendothelial space of 1 or more arteries.10 One such cell suffices. Examples of this lesion are shown in Figure 5. Intimal arteritis is a feature seen in both Acute TCMR and Active AMR. For Banff Lesion Score v, the most severely affected artery dictates the score.5 Similar lesions in arterioles are only coded as an asterisk behind the Banff Lesion Score ah and are disregarded for Banff Lesion Score v. Infiltrates buried deeper in the intima are not considered for the v Banff Lesion Score but have been recognized as Chronic Active TCMR since the 2005 update7 and graded in the 2017 update as Grade II.12 In the presence of tubulointerstitial hemorrhage (see Glossary of Terms in the appendix below) and/or and infarct (see Glossary of Terms in the appendix below) an asterisk “*” is attached to the Banff Lesion Score v (e.g. Banff v0*, v2*).5
v0—No arteritis.
v1—Mild to moderate intimal arteritis in at least 1 arterial cross section.
v2—Severe intimal arteritis with at least 25% luminal area lost in at least 1 arterial cross section.
v3—Transmural arteritis and/or arterial fibrinoid change and medial smooth muscle necrosis with lymphocytic infiltrate in vessel.11

Figure 5. Banff Lesion Score v (intimal arteritis). These photomicrographs demonstrate intimal arteritis, characterized by the presence of inflammatory cells beneath the lining endothelial cells. A, Banff Lesion Score v1—mild to moderate arteritis with mononuclear cells (long arrows) immediately beneath lifted endothelial cells (short arrow). H&E, original magnification 200. B, Banff Lesion Score v2—severe intimal arteritis involving over 25% of the arterial lumen with mononuclear cells (long arrows) immediately beneath lifted endothelial cells (short arrow). H&E, original magnification 200; C, Banff Lesion Score v3 -Transmural arteritis with fibrinoid necrosis in the media (long arrow) and mononuclear infiltrate in the arterial wall (short arrows). Intimal arteritis can be seen in both Acute TCMR Grade II and III and Active AMR. The most severely affected artery determines the score. Masson trichrome, original magnification 100. D, this image demonstrates an area of interstitial hemorrhage characterized by extravasation of red blood cells into the surrounding interstitium (arrow). Although there is not a specific Banff Lesion Score for this feature, it can be recorded by attaching an asterisk to the v score (e.g. v*). Note that this asterisk attached to Banff Lesion Score v is not specific for interstitial hemorrhage as an area of cortical infarct (not shown) would also be coded like this. H&E, original magnification x400.
Banff Lesion Score g (Glomerulitis)
This Banff Lesion Score evaluates the degree of inflammation within glomeruli (Figure 6). Glomerulitis is a form of microvascular inflammation (MVI) and is a feature of activity and antibody interaction with tissue in AMR. It can also be seen in recurrent or de novo glomerulonephritis which must be excluded by appropriate immunostains and EM.
Banff Lesion Score g is determined by the proportion of glomeruli showing glomerulitis defined as “complete or partial occlusion of 1 or more glomerular capillary by leukocyte infiltration and endothelial cell enlargement.”10 Leukocytes include polymorphonuclear cells and mononuclear cells. Both endothelial cell enlargement and leukocyte(s) must contribute to the complete or partial occlusion. Of note, glomerulitis must be scored even in glomeruli with segmental glomerulosclerosis. The denominator in this proportion is the number of non-sclerosed glomeruli in the biopsy.
g0—No glomerulitis.
g1—Segmental or global glomerulitis in less than 25% of glomeruli.
g2—Segmental or global glomerulitis in 25 to 75% of glomeruli.
g3—Segmental or global glomerulitis in more than 75% of glomeruli.11

Figure 6. Banff Lesion Score g (glomerulitis). Glomerulitis is a form of MVI and a feature of AMR activity. A, segmental glomerulitis; PAS, original magnification x400. B, Global glomerulitis. Note the characteristic complete or partial occlusion of capillary loops by leukocytes (short arrows) and endothelial cell swelling (long arrows). The score of g0 to g3 is determined by the percentage of glomeruli involved with either segmental or global glomerulitis. Complete or partial occlusion of a single capillary loop suffices to mark the respective glomerulus as involved by the glomerulitis. PAS, original magnification x400.
Banff Lesion Score ptc (Peritubular Capillaritis)
This Banff Lesion Score evaluates the degree of inflammation within peritubular capillaries (PTCs). Together with glomerulitis, peritubular capillaritis constitutes MVI as a feature of Active AMR or Chronic Active AMR. Peritubular capillaritis can be observed with pure Acute TCMR or Borderline as well. According to the Banff 2005 update, the Banff Lesion Score ptc is determined by the most severely involved PTC (Figure 7). Peritubular capillaries are by definition found in the cortex, their medullary equivalent are medullary vasa recta. The number of luminal inflammatory cells includes polymorphonuclear and mononuclear leukocytes, with an asterisk “*” used to indicate only mononuclear cells and absence of neutrophils. The extent of the PTC inflammation in the biopsy should be documented, either as focal (10-50% of cortical area) or diffuse (>50% of cortical area), but this does not contribute to the score. The presence of associated PTC dilatation may also be noted. Areas affected by acute pyelonephritis or necrosis and subcapsular cortex with nonspecific inflammation should not be scored. Inflammatory cells within PTCs must be distinguished from interstitial inflammation by careful examination of basement membrane stains (PAS, silver). Inflammatory cells within veins and medullary capillaries (vasa recta) should not be scored. Consequently, peritubular capillaritis and Banff Lesion Score ptc can only be assessed in the cortex after exclusion of areas of pyelonephritis and infarcted areas and exclusion of areas close to lymphoid aggregates to avoid confusion with lymphatic vessels. Banff Lesion Score ptc should not be based on longitudinally cut PTCs. Peritubular capillaries in areas affected by tubular atrophy and interstitial fibrosis must explicitly be considered for this Banff Lesion Score. Note that we have simplified the definition of ptc0 from the original version in the Banff 2017 update.12
ptc0—Maximum number of leukocytes <3.
ptc1—At least 1 leukocyte cell in ≥10% of cortical PTCs with 3-4 leukocytes in most severely involved PTC.
ptc2—At least 1 leukocyte in ≥10% of cortical PTC with 5-10 leukocytes in most severely involved PTC.
ptc3—At least 1 leukocyte in ≥10% of cortical PTC with >10 leukocytes in most severely involved PTC.11

Figure 7. Banff Lesion Score ptc (peritubular capillaritis). Peritubular capillaritis is a form of MVI and a feature of AMR activity and/or antibody interaction with tissue. Each image demonstrates the various ptc Scores which are in themselves determined by the number of inflammatory cells present within capillary lumina. A, Banff Lesion Score ptc1—Mild peritubular capillaritis defined as at least 1 cell in ≥10% of cortical PTCs (short arrows) with 3 to 4 in the most severely involved PTC (long arrow). Please note the slightly distended, open appearance of the capillary which can be a helpful feature; PAS, original magnification x400. B, Banff Lesion Score ptc2—Moderate peritubular capillaritis defined as at least 1 cell in ≥10% of cortical PTCs (short arrows) with 5-10 in most severely involved PTC (long arrow); PAS, original magnification x400. C, Banff Lesion Score ptc3—severe peritubular capillaritis defined as at least 1 cell in ≥10% of cortical PTCs (short arrows) with >10 in most severely involved PTC (long arrow). PAS, original magnification x400. D, this peritubular capillary is cut longitudinally (short arrow) and although containing 4 mononuclear cells is to be disregarded for scoring. However, the neighbouring peritubular capillary (long arrow) is cut orthogonally and would qualify for Banff Lesion Score ptc1 provided that at least 10% of all PTCs contain at least 1 leukocyte. PAS, original magnification x400.
Banff Lesion Score C4d
This score evaluates the extent of staining for C4d on endothelial cells of PTCs and medullary vasa recta by IF on snap frozen sections of fresh tissue or IHC on formalin-fixated and paraffin-embedded tissue. Although Banff 2007 states that areas of tubular atrophy and interstitial fibrosis have reduced PTC density that could affect the extent of staining,16 scoring of C4d in such cortical areas is not excluded.8 Scoring of C4d staining is based on the percentage of peritubular capillaries and vasa recta that has a linear, circumferential staining pattern (Figure 8). The minimal sample for evaluation is 5 high-power fields of cortex and/or medulla without scarring or infarction. C4d must not be scored in areas of infarction. On IF, staining should be at least 1+ in intensity.8 Strong staining is not required for a positive reading for IHC.11 In terms of extent of staining, with IF, Banff Lesion Score C4d ≥ 2 is considered positive and a criterion for antibody interaction with tissue and as equivalent to DSA (see Table 1 and SDC, Glossary of Terms in the appendix below), whereas with IHC, Banff Lesion Score C4d ≥ 1 is counted as positive already.11 Note that the definition below deviates from the one provided in the Banff 2015 update,11 in that it explicitly allows scoring in medullary vasa recta as originally intended, not only PTCs. The thresholds remain unchanged.
C4d0—No staining of PTC and medullary vasa recta (0%).
C4d1—Minimal C4d staining (>0 but <10% of PTC and medullary vasa recta).
C4d2—Focal C4d staining (10-50% of PTC and medullary vasa recta).
C4d3—Diffuse C4d staining (>50% of PTC and medullary vasa recta).

Figure 8. Banff Lesion Score C4d. A, IHC staining with peroxidase yielding a brown reaction product for C4d. An example of C4d3, this image demonstrates linear and circumferential staining of endothelial cells in virtually all peritubular capillaries. The staining was similar in all areas of the cortex and the medulla. The proportion of stained peritubular capillaries and medullary vasa recta informs the score. Immunoperoxidase, original magnification x400 B, IF staining for C4d. This image shows an example of a Banff Lesion Score of C4d3; using IF, a minimum score of C4d ≥ 2 is considered positive. In addition to this, the staining intensity for an individual capillary or medullary vas rectum must be at least 1+ on the usual scale from negative, trace, 1+, 2+ to 3+. Indirect IF, mouse antihuman C4d followed by fluorescein isothiocyanate-conjugated anti-mouse IgG, original magnification x100.
Banff Lesion Score ci (Interstitial Fibrosis)
This lesion score evaluates the extent of cortical fibrosis. The Banff Classification has never given a precise definition for individual areas of interstitial fibrosis (Figure 9). The reason for this is that Banff Lesion Score ci was meant to purely reflect the cortex composed of fibrous tissue, which does not necessarily correspond to areas that a pathologist would pick up as a patch of pathological tubulointerstitial fibrosis. The fraction of fibrous tissue in the cortex was considered as up to 5% for normal kidneys, hence the difference in cut-offs between ci1 and ct1.

Figure 9. Banff Lesion Scores for ct (tubular atrophy) and ci (interstitial fibrosis). The ci and ct Scores are both based on calculating the total percentage of cortex involved and require a diligent assessment of all foci of ct and ci as this process is often multifocal; ct and ci scores may not always be equally advanced. A, This image demonstrates an area of non-atrophic tubules (long arrow), compared to an area of tubular atrophy (short arrow) without an obvious increase in interstitial fibrosis. PAS, original magnification x200. There are different morphological types of tubular atrophy with differing appearances, including conventional, thyroidization, and endocrine-like types. B, Tubular atrophy of conventional type with interstitial fibrosis. Tubular areas are separated by areas of interstitial fibrosis and tubules show thickened basement membranes and > 50% reduction in tubular diameter (long arrows). PAS, original magnification x200. C, Thyroidization type atrophy. Here, tubules appear dilated, have flattened epithelial cells, and contain eosinophilic and brightly periodic-acid-Schiff-positive uromodulin casts (long arrow). PAS, original magnification x200. D, endocrine-like type, characterized by shrunken tubules with cuboidal epithelium and “tubular simplification” (long arrow). Compared with the other types of tubular atrophy, endocrine-like type does not have thickened basement membranes but still counts toward the ct score. PAS, original magnification x400.
A Working Group on this topic has produced useful reference guides (Figures 10 and 11).17
Of note, determination of Banff Lesion Score ci (as well as Banff Lesion Scores ct, ti, i-IFTA, t-IFTA) must also take into consideration the subcapsular cortex.
ci0—Interstitial fibrosis in up to 5% of cortical area.
ci1—Interstitial fibrosis in 6 to 25% of cortical area (mild interstitial fibrosis).
ci2—Interstitial fibrosis in 26 to 50% of cortical area (moderate interstitial fibrosis).
ci3—Interstitial fibrosis in >50% of cortical area (severe interstitial fibrosis).11

Figure 10. Visual analogue scales provided by the Banff Working Group on Fibrosis. This working group developed schematic diagrams to facilitate and standardize scoring of Banff Lesion Scores ci and ct. A, scale for the assessment of interstitial fibrosis without tubular atrophy. B, scale for the assessment of diffuse tubular atrophy with “replacement fibrosis.”17 Reproduced with kind permission from American Journal of Transplantation.

Figure 11. More visual analogue scales provided by the Banff Working Group on Fibrosis17 A, Scale for the assessment of patchy (left) and confluent (right) interstitial fibrosis without glomeruli. B, Scale for patchy (left) and confluent (right) fibrosis with glomeruli.17 Reproduced with kind permission from American Journal of Transplantation.
Banff Lesion Score ct (Tubular Atrophy)
This Banff Lesion Score evaluates the extent of cortical tubular atrophy which is usually tightly associated with the areas affected with interstitial fibrosis (Figure 9). Both correlate with time posttransplantation in the setting of progressive disease of any cause. Accordingly, neither Banff Lesion Scores ct nor ci have diagnostic specificity, but both have significant correlation with allograft function and prognosis.
Historically, the Banff classification has defined tubular atrophy as reflected in the Banff Lesion Score ct in the 1995 update4 as tubules with a thickened basement membrane or a reduction of greater than 50% in tubular diameter. Banff Lesion Score ct is still based on this definition of tubular atrophy. The definitions of moderate and severe atrophy from the Banff 2017 update12 are irrelevant for Banff Lesion Score ct. In the following definition, we have omitted the designation as “mild” for ct1, “moderate” for ct2 and “severe” for ct3 which was still included in the Banff 2015 update to avoid confusion between the definition of atrophy for an individual tubule as described above and the extent of tubular atrophy reflected in the Banff Lesion Score ct. Of note, Banff Lesion Score ct must be determined including the subcapsular cortex.
ct0—No tubular atrophy.
ct1—Tubular atrophy involving up to 25% of the area of cortical tubules.
ct2—Tubular atrophy involving 26 to 50% of the area of cortical tubules.
ct3—Tubular atrophy involving in >50% of the area of cortical tubules.11
Banff Lesion Score cv (Vascular Fibrous Intimal Thickening)
This Banff Lesion Score reflects the extent of arterial intimal thickening in the most severely affected artery (see Definition of Terms in the appendix below), not the average of all arteries.5 It does not discriminate between bland arterial intimal fibrosis and fibrosis containing leukocytes (Figure 12), although the latter is more likely to reflect chronic rejection (AMR and/or Chronic Active TCMR Grade II).12 A visual analogue scale for application in daily practice is provided in Figure 13.
cv0—No chronic vascular changes.
cv1—Vascular narrowing of up to 25% luminal area by fibrointimal thickening.
cv2—Vascular narrowing of 26 to 50% luminal area by fibrointimal thickening.
cv3—Vascular narrowing of more than 50% luminal area by fibrointimal thickening.11

Figure 12. Banff Lesion Score cv (vascular fibrous intimal thickening). A, Banff Lesion Score cv1—very mild purely fibrous thickening of the arterial intima (arrow). PAS, original magnification x200. B, Purely fibrous intimal thickening is depicted here in between the arrows in a trichrome stain. Note that this type of fibrous intimal thickening can also represent chronic damage in AMR. Masson trichrome, original magnification x400. C, Arterial fibrous intimal thickening in between the arrows. Note the multiplication of the internal elastic lamina. Trichrome-elastica, original magnification x400. D, Severe fibrointimal thickening cv3, with mononuclear infiltrates (long arrow) and foam cells (short arrow) in the fibrotic intima which can be a feature of both Chronic Active TCMR and Chronic Active AMR. Both types of lesion qualify for Banff Lesion Score cv, the score is determined by the loss of luminal area as shown in Figure 13 below. H&E, original magnification x100.

Figure 13. Visual analogue scale for the determination of Banff Lesion Score cv (arterial fibrous intimal thickening). The remaining luminal area is related to the square of the remaining luminal radius. Thus, relatively modest decreases in luminal radius of 13% or 29% translate into relatively large reductions in luminal area of 25% or 50%, reflecting the thresholds for Banff Lesion Score cv.
Banff cg Score (Glomerular Basement Membrane Double Contours)
Banff Lesion Score cg is based on the presence and extent of glomerular basement membrane (GBM) double contours or multilamination in the most severely affected glomerulus (Figure 14). Scoring should be carried out on PAS or silver stains; a designation as cg1a requires transmission EM to exclude cg0. With Banff Lesion Score cg > 0 (including both cg1a and cg1b), a diagnosis of transplant glomerulopathy (TG) (see Glossary of Terms in the appendix below) can be made, if other causes can be excluded. Banff Lesion Score cg > 0 can be a feature of Chronic AMR or Chronic Active AMR, but can also be seen in association with thrombotic microangiopathy of other causes than AMR, e.g. hepatitis C virus infection,18 hypertensive glomerulopathy,19 and glomerulonephritis. In analogy to Banff Lesion Score g, even in the presence of an explanation other than rejection for GBM double contours, Banff Lesion Score cg shall still be applied. Of note, Banff Lesion Score cg is not scored in ischemic or segmentally sclerosed glomeruli.1,11 Late ischemic glomerulopathy is defined as “thickening, wrinkling and collapse of glomerular capillary walls associated with or extracapillary fibrotic material”.1 As stated above, the earliest lesion of TG (cg1a) requires transmission EM for diagnosis. To detect such lesions, it is recommended that at centers with EM capability, “ultrastructural studies should be performed in all biopsies from patients who are sensitized, have documented DSA at any time post-transplantation and/or who have had a prior biopsy showing C4d staining, glomerulitis and/or peritubular capillaritis”. It is also advised that EM be considered in all biopsies performed from 6 months post-transplantation onward and in for-cause biopsies done from 3 months post-transplantation onward to determine if early changes of TG are present, prompting testing for DSA.10 Electron microscopy is also recommended for any biopsy done for the indication of increasing or new onset proteinuria.
cg0—No GBM double contours by light microscopy (LM) or EM.
cg1a—No GBM double contours by LM but GBM double contours (incomplete or circumferential) in at least 3 glomerular capillaries by EM, with associated endothelial swelling and/or subendothelial electron-lucent widening.
cg1b—Double contours of the GBM in 1-25% of capillary loops in the most affected nonsclerotic glomerulus by LM; EM confirmation is recommended if EM is available.
cg2—Double contours affecting 26 to 50% of peripheral capillary loops in the most affected glomerulus.
cg3—Double contours affecting more than 50% of peripheral capillary loops in the most affected-glomerulus.11
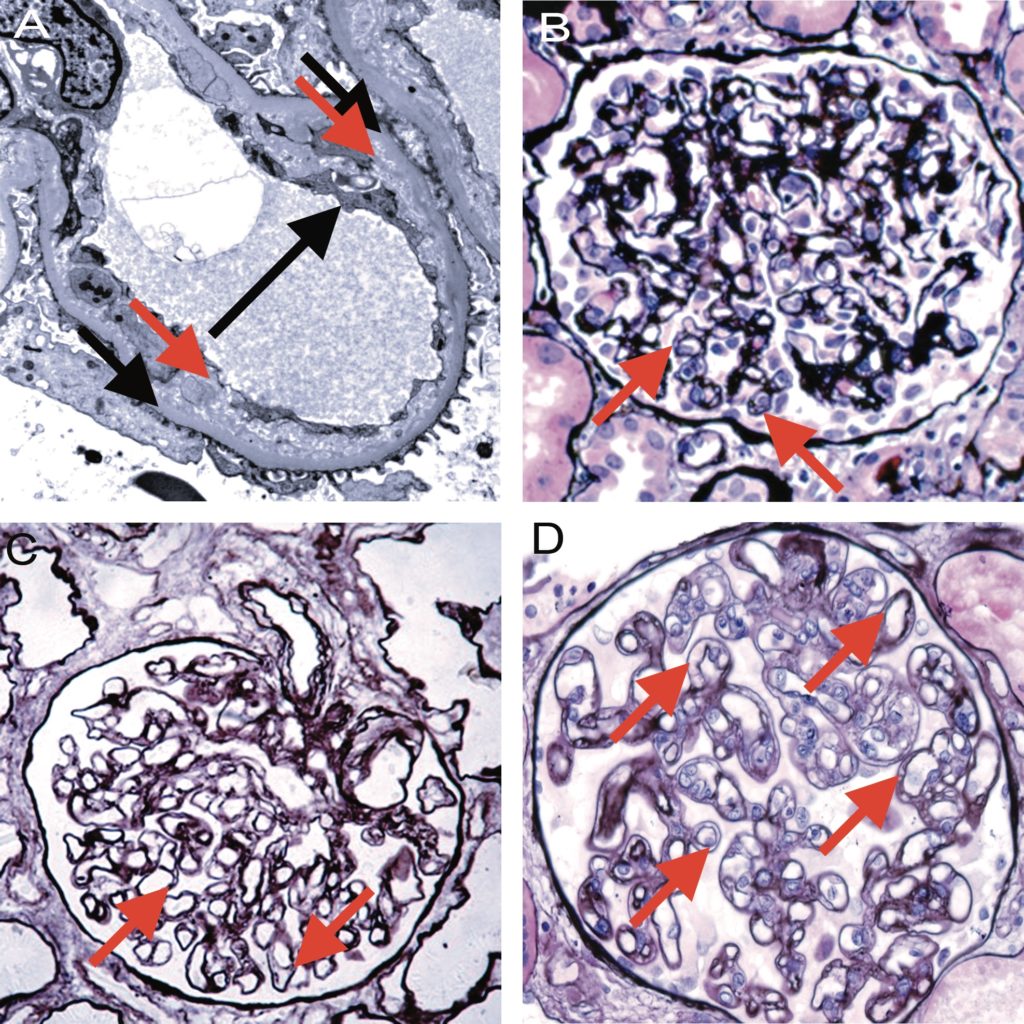
Figure 14. Banff Lesion Score cg (GBM double contours). This score represents the presence and extent of GBM double contours, a criterion for Chronic Active AMR. The score ranges from 0 to 3 and is based on the percentage of capillary loops with double contours as evident on EM (Banff Lesion Score cg1a) or LM (cg1b to cg3) in the most severely affected glomerulus. A, cg1a—GBM with double contours (short black arrows point to areas of original basement membrane and red arrows point to areas of new basement membrane formation), visible by EM only. Double contours, such as those noted in this image must be accompanied by endothelial cell swelling (long black arrow) and/or subendothelial widening and must involve at least 3 glomerular capillaries by EM for a Score of cg1a. Scores of greater than cg1a are based on light microscopic appearance which can best be examined by silver stains. Transmission EM, original magnification x8,000. B, Banff Lesion Score cg1b—double contours (arrow) identified on LM which involve up to 25% of the capillary loops of this most affected glomerulus. Jones silver stain, original magnification x400. C, Banff Lesion Score cg2—double contours (arrows) present in 26-50% of this most affected glomerulus; Jones silver stain, original magnification x400. D, Banff Lesion Score cg3—double contours (arrows) present in >50% of this most affected glomerulus. Jones silver stain, original magnification x400.
Banff Lesion Score mm (Mesangial Matrix Expansion)
This score evaluates the percentage of glomeruli with “moderate mesangial matrix expansion” in relation to all non-sclerosed glomeruli. Banff 1997 defines moderate mesangial matrix increase as “expansion of the matrix in the mesangial interspace to exceed the width of 2 mesangial cells in the average in at least 2 glomerular lobules”.5 An example is shown in Figure 15. Banff Lesion Score mm is currently not used to reach a Diagnostic Category and is purely descriptive.
mm0—No more than mild mesangial matrix increase in any glomerulus.
mm1—At least moderate mesangial matrix increase in up to 25% of nonsclerotic glomeruli.
mm2—At least moderate mesangial matrix increase in 26% to 50% of nonsclerotic glomeruli.
mm3—At least moderate mesangial matrix increase in >50% of nonsclerotic glomeruli.11
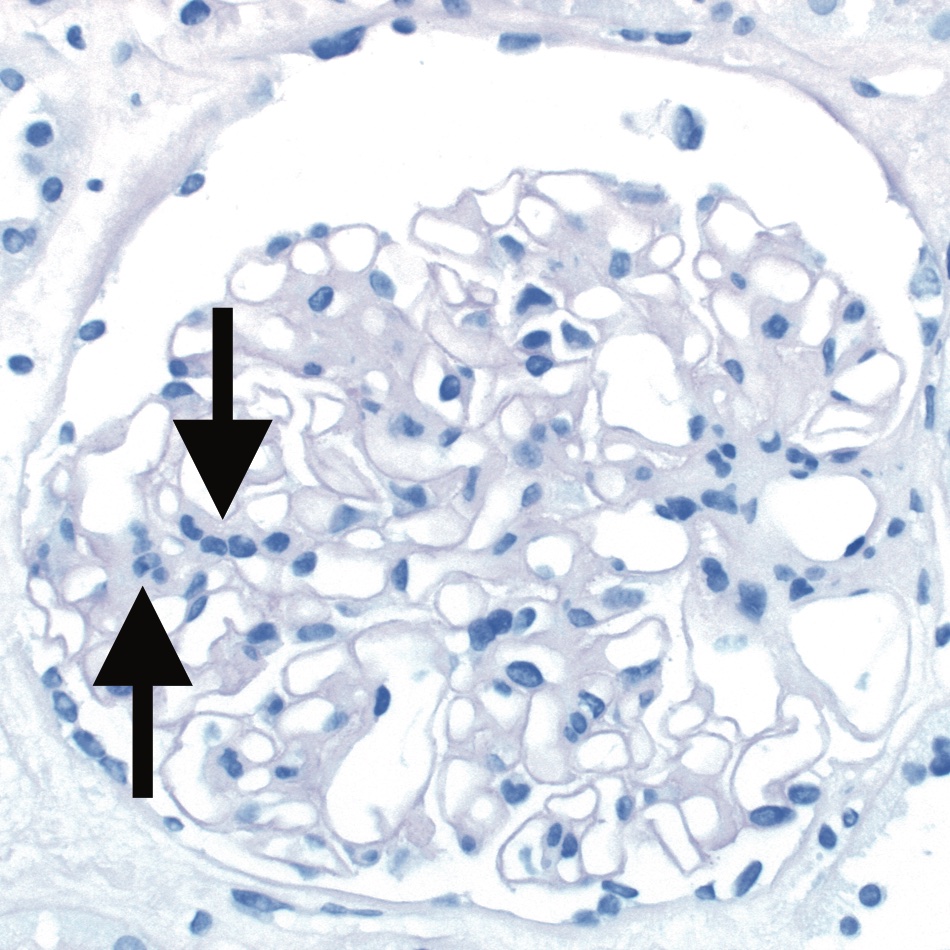
Figure 15. Banff Lesion Score mm (mesangial matrix expansion). This glomerulus fulfils the criteria for moderate mesangial matrix expansion with more than 2 mesangial cells in these 2 adjacent glomerular lobules (arrows). The proportion of glomeruli with such mesangial matrix expansion among all non-sclerosed glomeruli informs the score. The underlying reason for the mesangial matrix expansion in this biopsy was recurrent IgA glomerulonephritis revealed by IHC and EM. PAS, original magnification x400.
Banff Lesion Score ah (Arteriolar Hyalinosis)
This score evaluates the extent of arteriolar hyalinosis (Figure 16). The first edition of the Banff Classification defined ah as “nodular hyaline afferent arteriolar thickening suggestive of cyclosporine toxicity”; however, in Banff 1997 and later updates, Banff Lesion Score ah is defined simply as PAS-positive arteriolar hyaline thickening, as a finding of “uncertain significance”. An asterisk “*” is added to the ah score when arteriolitis is present (e.g. ah0*, ah2*).5 Banff Lesion Score ah is currently not used to reach a diagnostic category and is purely descriptive.
ah0—No PAS (PAS)-positive hyaline arteriolar thickening.
ah1—Mild to moderate PAS-positive hyaline thickening in at least 1 arteriole.
ah2—Moderate to severe PAS-positive hyaline thickening in more than 1 arteriole.
ah3—Severe PAS-positive hyaline thickening in many arterioles.11

Figure 16. Banff Lesion Score ah (arteriolar hyalinosis). A, Banff Lesion Score ah1—mild focal arteriolar hyalinosis (arrow). PAS, original magnification x630. B, ah2—Moderate arteriolar hyalinosis (arrow). PAS, original magnification x630. C, Banff Lesion Score ah2—Note in this image there is both linear (short arrow) and nodular hyalinosis (long arrow). For a score of ah2, more than 1 arteriole displaying moderate to severe is required. Jones silver stain, original magnification x630. D, Banff Lesion Score ah3—severe circumferential arteriolar hyalinosis with luminal occlusion. For Banff Lesion Score ah3, hyalinosis of this severity (arrow) must be present in many arterioles. PAS, original magnification x630.
Banff Lesion Score aah (Hyaline Arteriolar Thickening)
This Banff Lesion Score provides an alternative way of quantifying arteriolar hyalinosis. It was proposed in the 2007 update, because of the insufficient reproducibility of the Banff Lesion Score ah.8 This alternative tries to reach better reproducibility by focusing on circumferential or non-circumferential hyalinosis and the number of involved arterioles. Still, this lesion cannot be considered specific, that is, diagnostic for calcineurin inhibitor-related arteriolopathy. The use of this Banff Lesion Score aah has been left as optional since its introduction in 2007, no final decision has been reached whether it shall replace Banff Lesion Score ah. Banff Lesion Score aah is currently not used to reach a diagnostic category and is purely descriptive.
aah0—No typical lesions of calcineurin inhibitor-related arteriolopathy.
aah1—Replacement of degenerated smooth muscle cells by hyaline deposits in only 1 arteriole, without circumferential involvement.
aah2—Replacement of degenerated smooth muscle cells by hyaline deposits in more than 1 arteriole, without circumferential involvement.
aah3—Replacement of degenerated smooth muscle cells by hyaline deposits with circumferential involvement, independent of the number of arterioles involved.11
Banff Lesion Score ti (Total Inflammation)
This lesion score evaluates the extent of total cortical inflammation. According to the Banff 2007 update and in contrast to the Banff Lesion Score i, all of the cortical parenchyma, including areas of interstitial fibrosis and tubular atrophy (IFTA), subcapsular cortex and perivascular cortex including nodular infiltrates are considered for ti scoring.8 Mengel et al. found Banff Lesion Score ti to be better predictive of poor graft outcomes than the Banff Lesion Score i in cases where at least mild IFTA was present.18 The association between interstitial inflammation in areas of IFTA as reflected in Banff Lesion Score i-IFTA and decreased graft survival was noted by Mannon et al.19 and subsequently confirmed by others.20,21 As a consequence, Banff Lesion Score ti became part of the criteria for a diagnosis of Chronic Active TCMR Grade IA and IB;12 both Banff Lesion Scores ti and i-IFTA must be at least 2 to consider a diagnosis of Chronic Active TCMR Grade IA or IB.12
ti0— No or trivial interstitial inflammation (<10% of total cortical parenchyma).
ti1— 10-25% of total cortical parenchyma inflamed.
ti2— 26-50% of total cortical parenchyma inflamed.
ti3— >50% of total cortical parenchyma inflamed.11
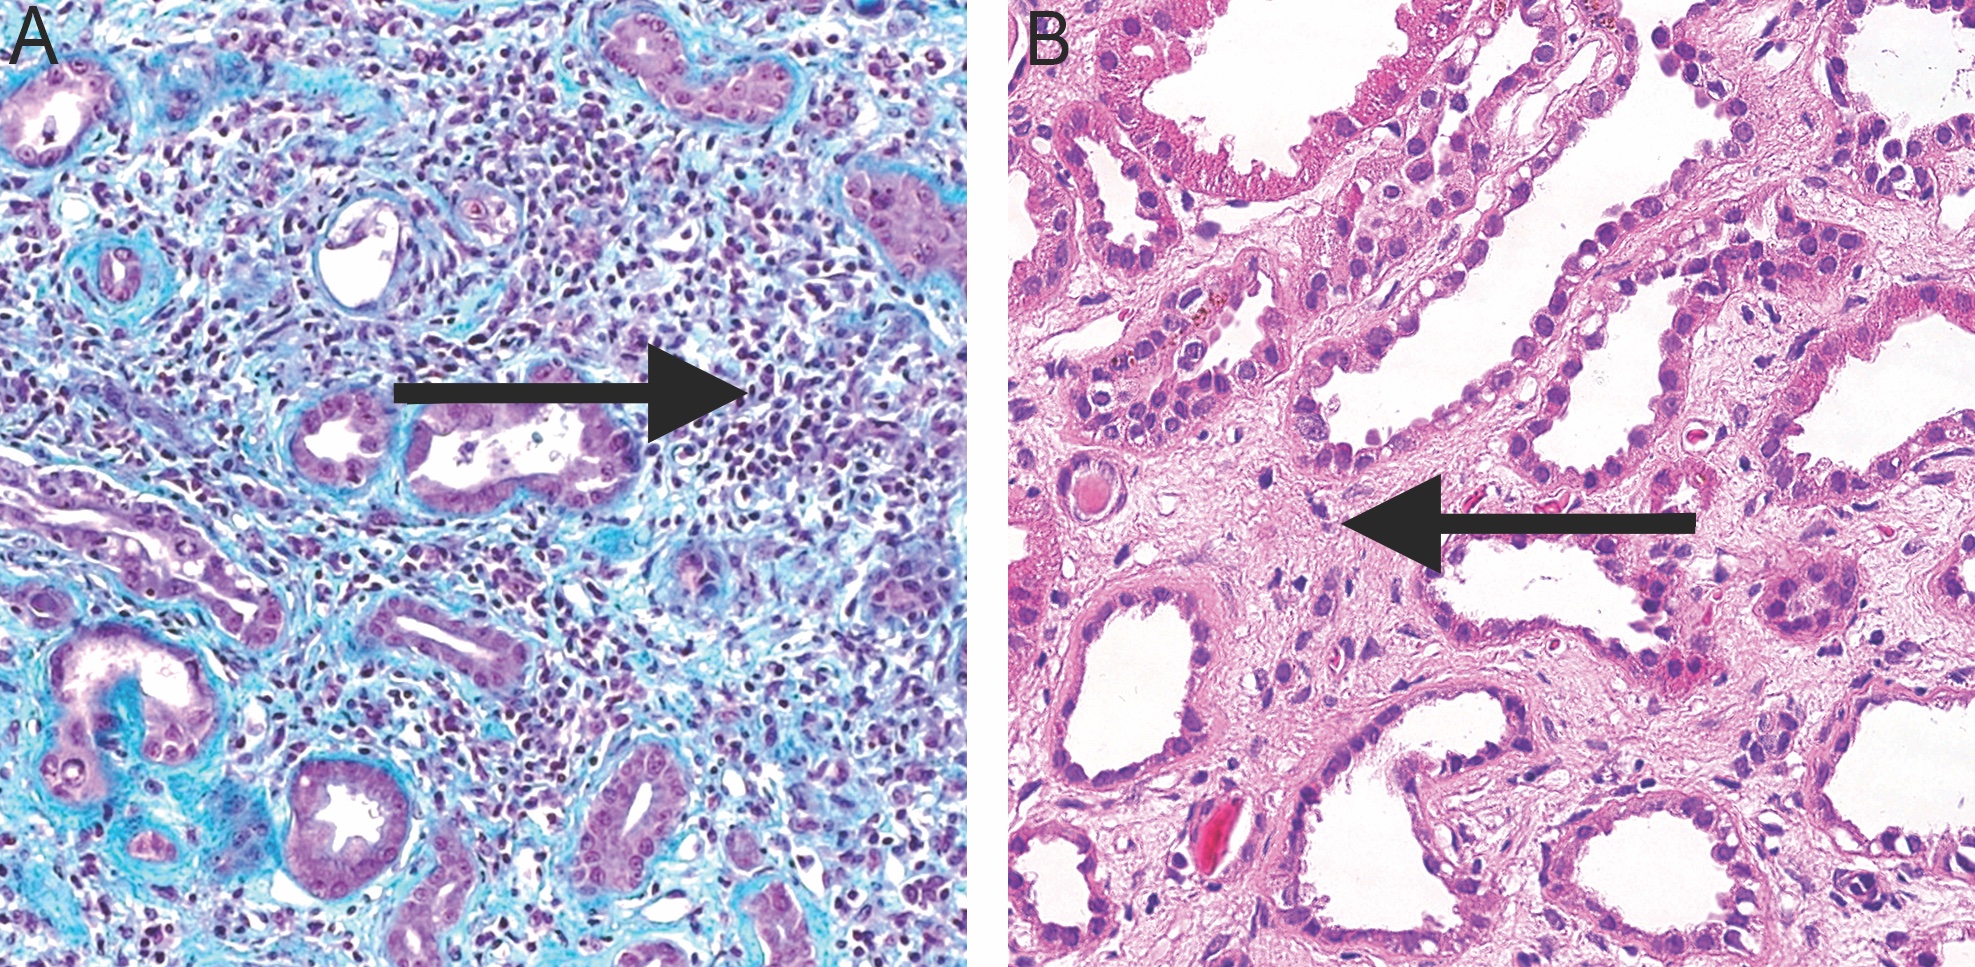
Figure 17. Banff Lesions Score i-IFTA (inflammation in areas of IFTA). Image A shows inflammation in areas of IFTA (arrow). This Lesion Score ranges from 0 to 3, based on the percentage of scarred areas of the cortex (i.e. areas qualifying for ci and ct) involved by inflammation. It is one of the criteria necessary for a diagnosis of Chronic Active TCMR Grade IA or IB. Masson trichrome, original magnification x200. B, In contrast shows interstitial fibrosis without significant infiltrate (arrow). H&E, original magnification x400.

Figure 18. Acute TMA. A, Acute TMA affecting a glomerulus with fibrin thrombi (long arrows) and fragmented red blood cells (short arrow) in capillary loops. Trichrome, original magnification x400. B, Acute TMA affecting a small arteriole (arrow). Acute TMA is one of the histological features used as histological evidence of acute tissue injury in Active AMR. However, TMA is not specific for AMR and can be seen in, for example, recurrent disease or calcineurin inhibitor toxicity. Trichrome, original magnification x400.
Banff Lesion Score i-IFTA (Inflammation in Area of IFTA)
This score evaluates the extent of inflammation in scarred cortex, i.e. areas that qualify for Banff Lesion Scores ci and ct (Figure 17). The Banff Lesion Score i-IFTA was first introduced to the Banff Classification in 2015.11 Both Banff Lesion Scores ti and i-IFTA must be at least 2 to consider a diagnosis of Chronic Active TCMR Grade IA or IB.12
i-IFTA0—No inflammation or less than 10% of scarred cortical parenchyma.
i-IFTA1—Inflammation in 10% to 25% of scarred cortical parenchyma.
i-IFTA2—Inflammation in 26% to 50% of scarred cortical parenchyma.
i-IFTA3—Inflammation in >50% of scarred cortical parenchyma.11
Banff Lesion Score t-IFTA
This Banff Lesion Score was fully introduced in Banff 2019.13 It refers to scoring of tubulitis in areas of IFTA. t-IFTA is graded according to presence of mononuclear cell infiltrates in the moderately but not severely atrophic cortical tubules in areas of IFTA. An example is given in Figure 4. Moderately atrophic cortical tubules are those that show a reduction in diameter of more than 50% but are not severely atrophic. Severely atrophic tubules are defined as tubules of diameter <25% of that of unaffected or minimally affected tubules in the biopsy, often with an undifferentiated- appearing, cuboidal or flattened epithelium (or in some cases even loss of epithelium with denudation of the tubular basement membrane), and pronounced wrinkling and/or thickening of the tubular basement membrane. This definition of severely atrophic tubules also includes very small, endocrine-like tubules with very narrow lumens, although the basement membranes of the latter may not be thickened.12
Of note, Banff Lesion Score t-IFTA must be determined including the subcapsular cortex.
t-IFTA0 – no mononuclear cells in tubules
t-IFTA1 – 1-4 mononuclear cells/tubular cross section
t-IFTA2 – 5-10 mononuclear cells/tubular cross section
t-IFTA3 – >10 mononuclear cells/tubular cross section
Banff Lesion Score pvl
Developed in the report of the Banff Working Group on Polyomavirus,22 this Banff Lesion Score was formally introduced into the Banff Classification in the 2019 update.13 Banff Lesion Score pvl is determined over the entire biopsy sample (cortex, medulla, scarred or unscarred). Tubular epithelial nuclei are considered positive (viral replication) with the typical viral inclusions and/or positive immunohistology (usually SV-40 large T antigen). Note that pvl is not determined by the ratio of positive nuclei to all nuclei but by the ratio of tubules/ducts with at least one positive nucleus to all tubules/ducts. Banff Lesion Scores pvl and ci yield the Class of Polyomavirus Nephropathy 1 (pvl1 and ci≤1), 2 (all other combinations of pvl and ci not qualifying for class 1 or 3) or 3 (pvl3 and ci≥2).22 Polyomavirus Nephropathy is formally recognized among the Category 6 diagnoses.
pvl0 – no positive nuclei in any tubules/ducts
pvl1 – ≤1% of all tubules/ducts
pvl2 – >1% to ≤10% of all tubules/ducts
pvl3 – >10% of all tubules/ducts

Figure 19. Banff Additional Diagnostic Parameter ptcml (peritubular capillary basement membrane multilayering) is only demonstrable by EM. A, This Additional Diagnostic Parameter is a criterion for AMR chronicity. It is defined as 7 or more layers of basement membrane in at least a single cortical peritubular capillary and 5 or more in at least 2 additional capillaries. This particular capillary shows 8 layers (arrow). Transmission EM, original magnification x14,000. B, this image demonstrates a peritubular capillary with 5 layers of basement membrane (arrow). Transmission EM, original magnification x10,000.
Table 1: This is a synopsis of the thresholds for all Banff Lesion Scores. The user of this table should be familiar with the exact definitions underlying each individual Banff Lesion Score. Reliance on these thresholds alone without consideration of the regulatory statutes behind these scores is strongly discouraged. Abbreviations: EM: electron microscopy, LM: light microscopy, max: maximum, PTC: peritubular capillary